Assist and Educate Visitors
Power Your Website with BG-Map Web-VQF
Add the power and capabilities of BG-Map to your website with Web-VQF. Visitors will learn about your garden and create their own maps with ease from home or on-site. And, your staff will gain unprecedented access to plant records and location maps.
Visitors can use their dsktop or mobile devices to search for plants by common name,
botanical name, species, or cultivar. Your garden staff can define
"Special Collections" that highlight plants of seasonal or other special
interest. And, visitors can print their own guide maps.
Web-VQF - Your garden's tireless guide.
Manage Your Facilities
The optional Facilities Management
software module tracks and manages your infrastructure,
including buildings, equipment, utilities, works of art, signage, memorials,
and much more.
It maintains records, tracks suppliers and contacts, and schedules maintenance. And, it allows you to find objects and create maps quickly.
Keep Your Maps Up to Date
The map is continuously updated to reflect current plant records data
stored in BG-BASE. If a plant is removed
or dies or if its name changes, the map is automatically updated.
The text on the map is automatically adjusted in size and content
to be legible, regardless of the size of the area being displayed.
BG-Map allows you to create maps to display your plant collection
in many different ways, including:
- Large Format Maps - These maps are produced on a plotter - D Size
(A1) or E Size (A0).
- Quadrant Maps - Display plants in a single map quadrant.
- Defined View Maps - Display plants within a garden area
of any size or shape. You can define and save an unlimited
number of garden views.
- Site Maps - Display plants for an entire site.
- Book Maps - These maps are printed on a laser or ink jet printer in
an easy to use and carry format, either 8-1/2" x 11" (A4) or
11" x 17" (A3) - perfect for use by
staff, volunteers, and even visitors. Several types of book maps can
be produced:
- Quadrant Book Maps - for a single map quadrant
- Quarter Quadrant Book Maps - divides a single map quadrant
into quarters to display further detail
- Defined View Book Maps - for a user defined area
- Snapshot Book Maps - highlights the location of a single plant,
selected by accession number, scientific name, or common name.
Show Both Existing and Proposed Plants
The Proposed Plants Feature provides a separate database in which you can record the source, size, and cost of proposed plants. And, you can link them to images.
Create planting lists and tabulate costs. Place proposed plants on the map, and coordinate their locations with existing accessioned plants and infrastructure - all from within BG-Map. .
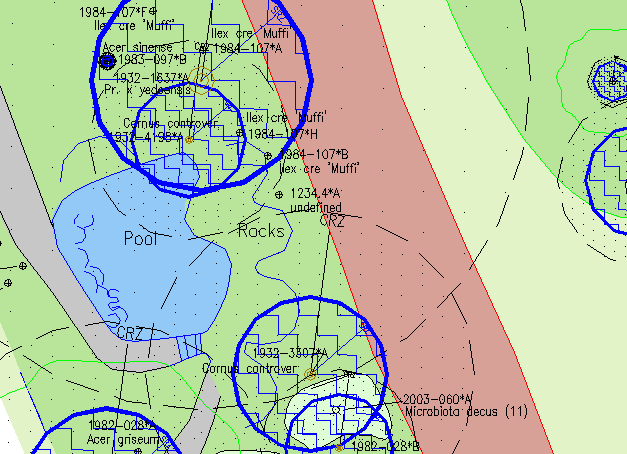
Protect Trees During Construction by Displaying Their Critical and Structural Root Zones
The Critical Root Zone (CRZ) is the area around a tree requiring protection from soil compaction during
construction. BG-Map can display Critical Root Zones, based on trunk diameter using general constant set for all species,
or which can be set specifically for each genus or species.
The Structural Root Zone (SRZ) is the area around a tree containing the roots that anchor the tree.
Cutting these roots can destabilize the tree or result in decay or fungal infections that can impact tree health.
BG-Map can display the Structural Root Zone calculated from the tree's current DBH measurement.
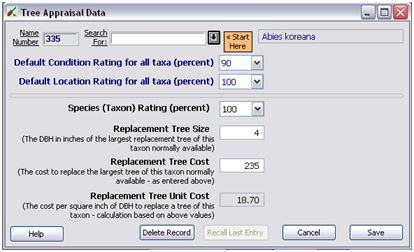
Calculate the Appraised Value of Trees
Tree appraisal data can be entered directly into BG-Map. You can use this data to create reports and maps containing tree values automatically calculated by BG-Map.
Keep Track of Tree Hazards
Use a tablet device or a hand-held computer to record tree hazard conditions, calculate a hazard score and record recommended actions. Use BG-Map to generate reports and maps to show hazard tree locations and list details.
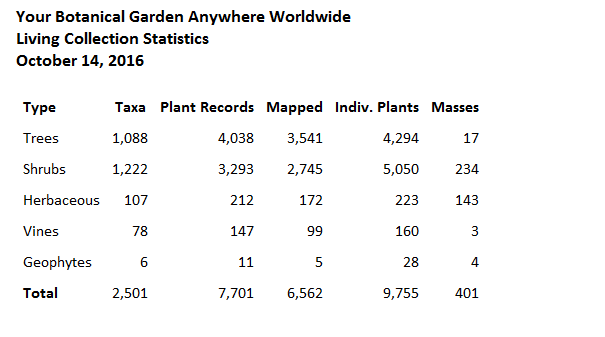
Generate a Living Collections Statistics Report
BG-Map can easily create a report showing the living collection broken down by plant habits and showing
the number of taxa and plant records for each, how many plants have been mapped and how many individual plants and masses exist.
This report is also available to staff via Web-VQF.
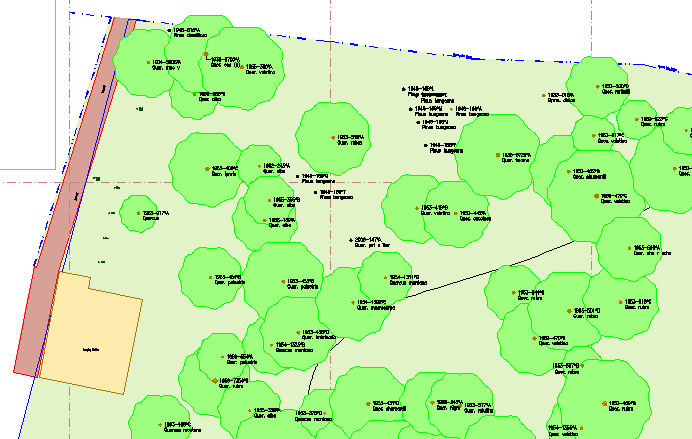
Show Canopies and Trunks to Scale
You can display tree canopies and trunks to scale using data about
plant sizes recorded in BG-BASE. Canopies and trunks can be
displayed at their current sizes, using data
stored in the BG-BASE PLANTS file or at their ultimate
sizes, using data stored in the NAMES file.
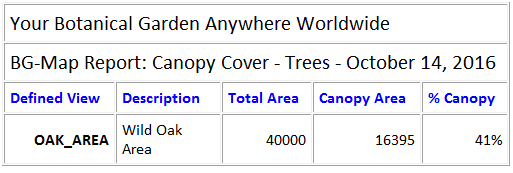
Print a Tree Canopy Coverage Report
Using data stored in BG-BASE, you can print reports showing tree canopy coverage for any area of the map
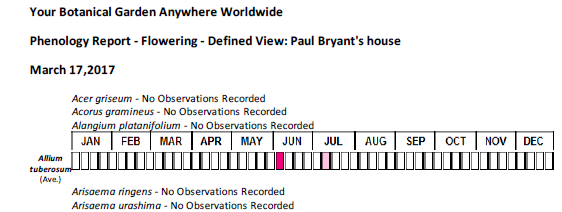
Print a Phenology Report
Print a report showing average flowering or fruiting times using actual observations in your garden as stored in
BG-BASE. Reports can cover plants of a specified genus or garden area.
Create Customized Maps
One of BG-Map's most powerful features is the ability
to create customized maps that interpret a plant collection
by highlighting, in different user-assigned colors, plants
with various characteristics . Data entry forms allow
you to easily define plant groupings based on condition,
provenance, family, genus, species, planting dates, or
flowering times.

For more complex plant groupings,
you can use the powerful query language built into BG-BASE.
This will enable you to specify groupings based on
any of hundreds of characteristics. Add to this the user
defined fields provided by BG-BASE,
and the possibilities for defining plant groupings are virtually
limitless.
Use Custom Symbols
You can differentiate plants by family, genus, habit or special characteristics using custom user-defined symbols.
The symbols are displayed to scale at the current size
of the plant, using size data stored in the BG-BASE plant records
database. Plants can also be displayed at their ultimate sizes
as an aid in visualizing the mature appearance of newly planted
areas.
Both symbols and colors can be used together to create customized
interperative maps for educational or scientific purposes.
Create Flexible Plant Lists
Each map can have a plant list attached.
The plant list includes all plants displayed on the map and
can be sorted in numerical order by accession number
or in alphabetical order by scientific plant name.

BG-Map offers great flexibility in formatting plant lists. You can create
an unlimited number of Plant List Formats to specify data to be listed. To
create a Plant List Format, just click on the desired fields from
a popup display.
Quickly Look Up Data About a Plant

You can quickly look up data about any plant currently displayed
on the map by simply clicking it. BG-Map will automatically
display a report about the selected plant. You can customize the
report by defining a Plant List Format
to determine which data fields will be displayed. (See "Plant
Lists" above.)

Find any Plant by Name
You can find any mapped or unmapped plant in your entire collection by entering the first few letters of its botanical or common name.

Or use the Plant Search Tool to easily find mapped or unmapped plants, searching on several
criteria and sorting the results as desired. The results can be used to display plant information,
create maps or create plant lists.


BG-Map instantly zooms to any selected plant.
You can print information about the plant or print a map to help you to
locate the plant. Or, you can select a number of plants and create a map showing their locations.

Designate Memorial Plants
 BG-Map allows your to designate trees and other plants as memorials and record information such as donor, honoree, alumni data and comments. Information can be retrieved by staff or by visitors through the Web-VQF web interface.
Archive Your Data
BG-Map automatically archives dead or removed plants. Archived
plants can later be restored to the map as an aid in
documenting the past history of a collection.
Automatically Survey Plant Locations
The BG-Map Total Station Interface
is a fast and accurate means to map your plant collection.
It uses an electronic surveying instrument connected to a
portable computer, eliminating measuring tapes and hand
written survey notes.
And, the BG-Map GPS Interface allows you to import GPS data
directly into BG-Map for fast and efficient surveying of plant locations.
Print Maps
BG-Map automatically formats and prints maps on D size (A1) or E Size (A0) plotters, and
on 8-1/2" x 11" (A4) or 11" x 17" (A3) printers.
Just one click, and BG-Map takes care of all the details by
creating a plot script for AutoCAD or CMS IntelliCAD to follow. No AutoCAD or CMS IntelliCAD knowledge is
required. Each map includes a title block that
shows the plot scale, date, name of the person creating
the map, and information about the plant selection criteria used to
create the map. If requested, a plant list will be
attached to the map.
Record Plant Size and Condition in the Field
Garden Notepad 3 is a time
and labor-saving application that allow garden staff to capture and record
information about the size and condition of plants and record images on a laptop computer or tablet.
Example 1 - Create a Plant Inventory.
"How can I create a list of all plants in bed QQ?"
BG-Map quickly creates maps and plant lists for beds and irregularly shaped areas.
Just draw an outline around the area that you wish to include.
Example 2 - Find All Plants of One Genus.
"Where are all the Hamamelis in our living collection?"
BG-Map can produce maps highlighting plants by genus, family, country of origin,
bloom time, and many other criteria using user-assigned colors and symbols.
And, you can add a plant list detailing each plant shown on the map.
Example 3 - Help a Visitor Find a Plant.
"How can I help a visitor find that Rhapidophyllum hystrix
near the West Gate?"
Add the power and capabilities of BG-Map to your website with Web-VQF.
Visitors will learn about your garden and create their own maps with ease from home or on-site.
And, your staff will gain unprecedented access to plant records and location maps.
Example 4 - Plot a Map to Scale.
"Our landscape architect needs a map of the Rose
Garden at a scale of 1/4 inch = 1 foot. I'm not familiar with dimensions
and scales. How do I do I print it?"
BG-Map allows you to easily produce maps of any area to scale without
knowing the intricacies of AutoCAD or IntelliCAD plot setup. Just define the area you
wish to include, and BG-Map completely automates the plotting process,
producing a map complete with title, date, and scale.
Example 5 - Print a Map Along With a Verbose Plant List.
"How can Karen create a map showing all wild collected
plants in the South Slope Garden and a listing of each plant on
the map along with its source, country and province of origin,
latitude, longitude, and elevation of collection, and field
collection notes?"
She can use BG-Map to create a customized plant list by clicking
on the data fields that she wishes to include. And, she can reuse
her report template to create other maps and plant lists.
Example 6 - Create an Interpretive Map.
"Larry really needs a map
of the area around the administration building showing palms,
distinguished by continent of origin - Asian in one color, African
in another, etc. And, he needs a plant list with separate listings
for each group. How can he start?"
BG-Map makes it easy to create maps that display multiple plants
groups using user-assigned colors and symbols. Up to 9 different
plant groupings can be differentiated by color, and an unlimited
number of symbols can be used to distinguish plants by genus or family.